South Africa
- Australia
- Austria
- Belgium
- Brazil
- Canada
- Chile
- China, People's Republic of
- Colombia
- Costa Rica
- Czechia
- Denmark
- Estonia
- Finland
- France
- Germany
- Greece
- Hungary
- Iceland
- India
- Indonesia
- Ireland
- Israel
- Italy
- Japan
- Korea
- Latvia
- Lithuania
- Luxembourg
- Mexico
- Netherlands
- New Zealand
- Norway
- Poland
- Portugal
- Russian Federation
- Slovak Republic
- Slovenia
- South Africa
- Spain
- Sweden
- Switzerland
- Türkiye
- United Kingdom
- United States
Previous editions
Further country information
Selected indicators for South Africa Share
Population
Population, Million persons, 2002-2022
60.6 million
Growth rate: <%population-growth-rate%>%
Income inequality
Income inequality, 0 = complete equality; 1 = complete inequality, latest available year
Education
<%pisamath-info-bubble%>
<%pisaread-info-bubble%>
<%pisascience-info-bubble%>
CO2 emissions
Air and GHG emissions, Carbon dioxide (CO2), latest available year
6.6 tonnes per capita
GDP
Gross domestic product (GDP), US dollars/capita, 2022
Real GDP forecast, Annual growth rate (%), 2025
15 953 US$ per capita
Debt
General government debt, % of GDP, 2022
Household debt:
<%debthousehold-latest-value%> % of disposable income
Government debt:
74.9 % of GDP
Tax
<%tax-latest-year-dashboard-countries-start-time-info-bubble%>
<%tax-latest-value%> % of GDP
Unemployment
<%unemployment-latest-value-info-bubble%>
<%unemployment-latest-value%> % of labour force
Country profile of South Africa
| Agriculture | Latest | Trend | Ranking | |
|---|---|---|---|---|
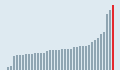
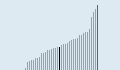
| Crop productionIndicator |
4.16
Wheat Tonnes/hectare 2030 South Africa Tonnes/hectare |
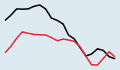
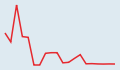
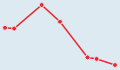
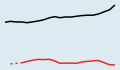
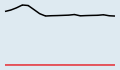
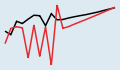 Wheat
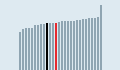
WheatTonnes/hectare 2011-2030 South Africa (red), OECD - Total (black) |
||
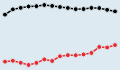
| Meat consumptionIndicator |
13.8
Beef and veal Kilograms/capita 2029 South Africa Kilograms/capita |
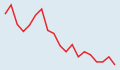
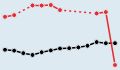
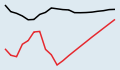 Beef and veal
Kilograms/capita 2010-2029 South Africa (red), OECD - Total (black) |
||
Find all indicators on Agriculture
| Development | Latest | Trend | Ranking | |
|---|---|---|---|---|
| Distribution of net ODAIndicator | ||||
Find all indicators on Development
| Economy | Latest | Trend | Ranking | |
|---|---|---|---|---|
| Composite leading indicator (CLI)Indicator |
98.91
Amplitude adjusted Long-term average = 100 Nov-2023 South Africa Long-term average = 100 |
|||
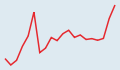
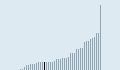
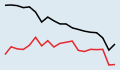
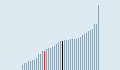
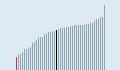
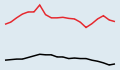
| FDI stocksIndicator |
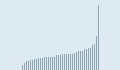
60.7
Outward % of GDP 2022 South Africa % of GDP |
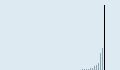
 Outward
% of GDP 2005-2022 South Africa (red), OECD - Total (black) |
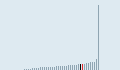
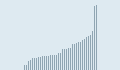
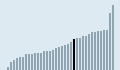
 Outward
% of GDP 2022 South Africa (red), OECD - Total (black) |
|
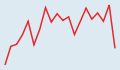
| Inflation (CPI)Indicator |
5.6
Total Annual growth rate (%) Nov-2023 South Africa Annual growth rate (%) |
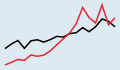
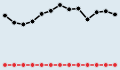
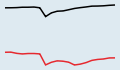
 Total
TotalAnnual growth rate (%) Apr-2022-Nov-2023 South Africa (red), OECD - Total (black) |
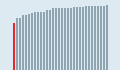
 Total
TotalAnnual growth rate (%) Nov-2023 South Africa (red), OECD - Total (black) |
|
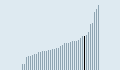
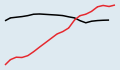
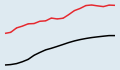
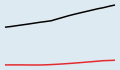
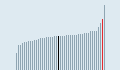
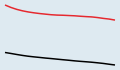
| Net national incomeIndicator |
13 538
Total US dollars/capita 2022 South Africa US dollars/capita |
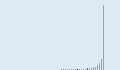
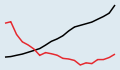
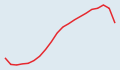
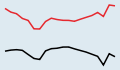
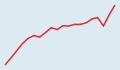 Total
TotalUS dollars/capita 2003-2022 South Africa (red), OECD - Total (black) |
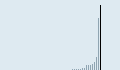
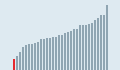 Total
TotalUS dollars/capita 2022 South Africa (red) |
|
| Trade in goods and servicesIndicator |
33.5
Exports % of GDP 2022 South Africa % of GDP |
 Exports
% of GDP 2003-2022 South Africa (red) |
 Exports
% of GDP 2022 South Africa (red) |
|
Find all indicators on Economy
| Education | Latest | Trend | Ranking | |
|---|---|---|---|---|
| Youth not in employment, education or training (NEET)Indicator |
14.2
15-19 year-old men % in same age group 2022 South Africa % in same age group |
 15-19 year-old men
% in same age group 2013-2022 South Africa (red), OECD - Average (black) |
 15-19 year-old men
% in same age group 2022 South Africa (red), OECD - Average (black) |
|
Find all indicators on Education
| Energy | Latest | Trend | Ranking | |
|---|---|---|---|---|
| Crude oil productionIndicator |
23.5
Total Thousand toe 2021 South Africa Thousand toe |
 Total
TotalThousand toe 2002-2021 South Africa (red) |
 Total
TotalThousand toe 2021 South Africa (red) |
|
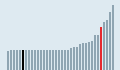
| Primary energy supplyIndicator |
0.16
Total Toe/1 000 US dollars 2021 South Africa Toe/1 000 US dollars |
 Total
TotalToe/1 000 US dollars 2003-2021 South Africa (red) |
 Total
TotalToe/1 000 US dollars 2022 South Africa (red) |
|
| Renewable energyIndicator |
6.2
Total % of primary energy supply 2020 South Africa % of primary energy supply |
 Total
Total% of primary energy supply 2001-2020 South Africa (red), OECD - Total (black) |
 Total
Total% of primary energy supply 2021 OECD - Total (black) |
|
| Environment | Latest | Trend | Ranking | |
|---|---|---|---|---|
| Air and GHG emissionsIndicator |
6.6
Carbon dioxide (CO2) Tonnes/capita 2021 South Africa Tonnes/capita |
 Carbon dioxide (CO2)
Tonnes/capita 2003-2021 South Africa (red), OECD - Total (black) |
 Carbon dioxide (CO2)
Tonnes/capita 2022 South Africa (red), OECD - Total (black) |
|
| Municipal wasteIndicator | ||||
Find all indicators on Environment
| Finance | Latest | Trend | Ranking | |
|---|---|---|---|---|
| Broad money (M3)Indicator |
174.47
Total 2015=100 Sep-2023 South Africa 2015=100 |
 Total
Total2015=100 Feb-2022-Sep-2023 South Africa (red), OECD - Total (black) |
 Total
Total2015=100 Dec-2018 South Africa (red), OECD - Total (black) |
|
| Insurance spendingIndicator |
7.0
Total % of GDP 2022 South Africa % of GDP |
 Total
Total% of GDP 2010-2022 South Africa (red), OECD - Total (black) |
 Total
Total% of GDP 2022 South Africa (red), OECD - Total (black) |
|
| Long-term interest ratesIndicator |
11.8
Total % per annum Nov-2023 South Africa % per annum |
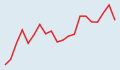 Total
Total% per annum Apr-2022-Nov-2023 South Africa (red) |
 Total
Total% per annum Nov-2023 South Africa (red) |
|
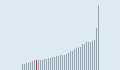
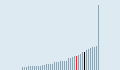
| Pension funds' assetsIndicator |
119 423.3
Total Million US dollars 2022 South Africa Million US dollars |
 Total
TotalMillion US dollars 2003-2022 South Africa (red) |
 Total
TotalMillion US dollars 2022 South Africa (red) |
|
| Short-term interest ratesIndicator |
8.5
Total % per annum Nov-2023 South Africa % per annum |
 Total
Total% per annum Apr-2022-Nov-2023 South Africa (red), Euro area (19 countries) (black) |
 Total
Total% per annum Nov-2023 South Africa (red), Euro area (19 countries) (black) |
|
Find all indicators on Finance
| Government | Latest | Trend | Ranking | |
|---|---|---|---|---|
| General government revenueIndicator | ||||
| General government spendingIndicator | ||||
Find all indicators on Government
| Health | Latest | Trend | Ranking | |
|---|---|---|---|---|
| Hospital bedsIndicator |
2.3
Total Per 1 000 inhabitants 2010 South Africa Per 1 000 inhabitants |
 Total
TotalPer 1 000 inhabitants 1998-2010 South Africa (red), OECD - Total (black) |
 Total
TotalPer 1 000 inhabitants 2021 |
|
| Length of hospital stayIndicator | ||||
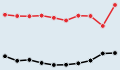
| Life expectancy at birthIndicator |
59.5
Men Years 2022 South Africa Years |
 Men
MenYears 2003-2022 South Africa (red) |
 Men
MenYears 2022 South Africa (red) |
|
| Innovation and Technology | Latest | Trend | Ranking | |
|---|---|---|---|---|
| Gross domestic spending on R&DIndicator |
0.6
Total % of GDP 2020 South Africa % of GDP |
 Total
Total% of GDP 2000-2020 South Africa (red), OECD - Total (black) |
 Total
Total% of GDP 2021 OECD - Total (black) |
|
| ICT goods exportsIndicator |
904.0
Total Million US dollars 2012 South Africa Million US dollars |
 Total
TotalMillion US dollars 2000-2012 South Africa (red), OECD - Total (black) |
 Total
TotalMillion US dollars 2012 South Africa (red), OECD - Total (black) |
|
| Triadic patent familiesIndicator |
22.4
Total Number 2020 South Africa Number |
 Total
TotalNumber 2001-2020 South Africa (red), OECD - Total (black) |
 Total
TotalNumber 2020 South Africa (red), OECD - Total (black) |
|
Find all indicators on Innovation and Technology
| Jobs | Latest | Trend | Ranking | |
|---|---|---|---|---|
| Employment rateIndicator |
40.0
Total % of working age population Q2-2023 South Africa % of working age population |
 Total
Total% of working age population Q3-2018-Q2-2023 South Africa (red), OECD - Total (black) |
 Total
Total% of working age population Q3-2023 |
|
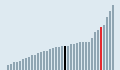
| Long-term unemployment rateIndicator |
70.7
Total % of unemployed 2022 South Africa % of unemployed |
 Total
Total% of unemployed 2003-2022 South Africa (red), OECD - Total (black) |
 Total
Total% of unemployed 2022 South Africa (red), OECD - Total (black) |
|
| Part-time employment rateIndicator |
10.6
Total % of employment 2022 South Africa % of employment |
 Total
Total% of employment 2008-2022 South Africa (red), OECD - Total (black) |
 Total
Total% of employment 2022 South Africa (red), OECD - Total (black) |
|
| Society | Latest | Trend | Ranking | |
|---|---|---|---|---|
| Elderly populationIndicator |
6.2
Total % of population 2022 South Africa % of population |
 Total
Total% of population 2003-2022 South Africa (red), OECD - Total (black) |
 Total
Total% of population 2022 South Africa (red), OECD - Total (black) |
|
| Fertility ratesIndicator |
2.37
Total Children/woman 2021 South Africa Children/woman |
 Total
TotalChildren/woman 2002-2021 South Africa (red), OECD - Average (black) |
 Total
TotalChildren/woman 2021 South Africa (red), OECD - Average (black) |
|
| Young populationIndicator |
28.1
Total % of population 2022 South Africa % of population |
 Total
Total% of population 2003-2022 South Africa (red), OECD - Total (black) |
 Total
Total% of population 2022 South Africa (red), OECD - Total (black) |
|
