Russian Federation
- Australia
- Austria
- Belgium
- Brazil
- Canada
- Chile
- China, People's Republic of
- Colombia
- Costa Rica
- Czechia
- Denmark
- Estonia
- Finland
- France
- Germany
- Greece
- Hungary
- Iceland
- India
- Indonesia
- Ireland
- Israel
- Italy
- Japan
- Korea
- Latvia
- Lithuania
- Luxembourg
- Mexico
- Netherlands
- New Zealand
- Norway
- Poland
- Portugal
- Russian Federation
- Slovak Republic
- Slovenia
- South Africa
- Spain
- Sweden
- Switzerland
- Türkiye
- United Kingdom
- United States
Previous editions
Further country information
Selected indicators for Russia Share
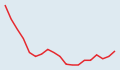
Population
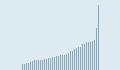
Population, Million persons, 2002-2022
145.2 million
Growth rate: <%population-growth-rate%>%
Income inequality
Income inequality, 0 = complete equality; 1 = complete inequality, latest available year
Education
Mathematics performance (PISA), Mean score, 2018
Reading performance (PISA), Mean score, 2018
Science performance (PISA), Mean score, 2018
CO2 emissions
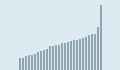
Air and GHG emissions, Carbon dioxide (CO2), latest available year
11.7 tonnes per capita
GDP
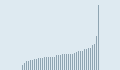
Gross domestic product (GDP), US dollars/capita, 2022
Real GDP forecast, Annual growth rate (%), 2025
<%gdp-latest-value%> US$ per capita
Debt
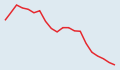
Household debt, % of net disposable income, 2019
Household debt:
37.4 % of disposable income
Government debt:
<%debtgovernment-latest-value%> % of GDP
Tax
<%tax-latest-year-dashboard-countries-start-time-info-bubble%>
<%tax-latest-value%> % of GDP
Unemployment
<%unemployment-latest-value-info-bubble%>
<%unemployment-latest-value%> % of labour force
Country profile of Russian Federation
| Agriculture | Latest | Trend | Ranking | |
|---|---|---|---|---|
| Crop productionIndicator |
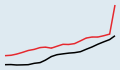
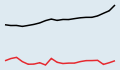
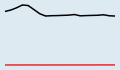
3.01
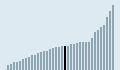
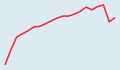
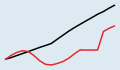
Wheat Tonnes/hectare 2030 Russia Tonnes/hectare |
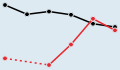
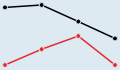
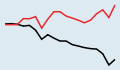
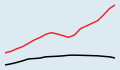
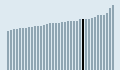
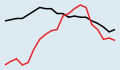
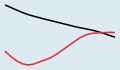
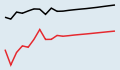 Wheat
WheatTonnes/hectare 2011-2030 Russia (red), OECD - Total (black) |
||
| Meat consumptionIndicator |
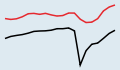
10.1
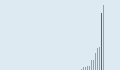
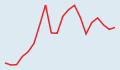
Beef and veal Kilograms/capita 2029 Russia Kilograms/capita |
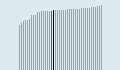
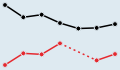
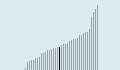
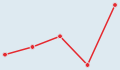
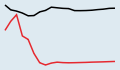 Beef and veal
Kilograms/capita 2010-2029 Russia (red), OECD - Total (black) |
||
Find all indicators on Agriculture
| Development | Latest | Trend | Ranking | |
|---|---|---|---|---|
| Distribution of net ODAIndicator | ||||
| Net ODAIndicator | ||||
| Total official and private flowsIndicator | ||||
Find all indicators on Development
| Economy | Latest | Trend | Ranking | |
|---|---|---|---|---|
| Composite leading indicator (CLI)Indicator | ||||
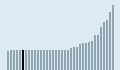
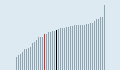
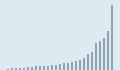
| FDI stocksIndicator |
14.0
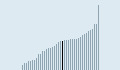
Outward % of GDP 2022 Russia % of GDP |
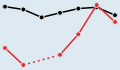
 Outward
% of GDP 2005-2022 Russia (red), OECD - Total (black) |
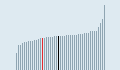
 Outward
% of GDP 2022 Russia (red), OECD - Total (black) |
|
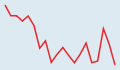
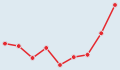
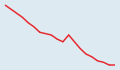
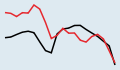
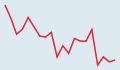
| Inflation (CPI)Indicator |
16.7
Total Annual growth rate (%) Mar-2022 Russia Annual growth rate (%) |
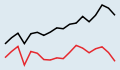
 Total
TotalAnnual growth rate (%) Aug-2020-Mar-2022 Russia (red), OECD - Total (black) |
 Total
TotalAnnual growth rate (%) Nov-2023 OECD - Total (black) |
|
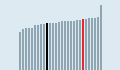
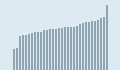
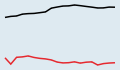
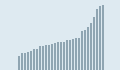
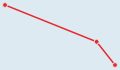
| Net national incomeIndicator |
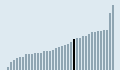
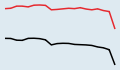
24 938
Total US dollars/capita 2019 Russia US dollars/capita |
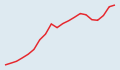 Total
TotalUS dollars/capita 2000-2019 Russia (red), OECD - Total (black) |
 Total
TotalUS dollars/capita 2022 |
|
| Trade in goods and servicesIndicator |
25.5
Exports % of GDP 2020 Russia % of GDP |
 Exports
% of GDP 2001-2020 Russia (red) |
 Exports
% of GDP 2022 |
|
Find all indicators on Economy
| Education | Latest | Trend | Ranking | |
|---|---|---|---|---|
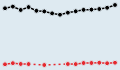
| Mathematics performance (PISA)Indicator |
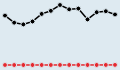
490
Boys Mean score 2018 Russia Mean score |
 Boys
BoysMean score 2003-2018 Russia (red), OECD - Average (black) |
 Boys
BoysMean score 2018 Russia (red), OECD - Average (black) |
|
| Reading performance (PISA)Indicator |
466
Boys Mean score 2018 Russia Mean score |
 Boys
BoysMean score 2000-2018 Russia (red), OECD - Average (black) |
 Boys
BoysMean score 2018 Russia (red), OECD - Average (black) |
|
| Science performance (PISA)Indicator |
477
Boys Mean score 2018 Russia Mean score |
 Boys
BoysMean score 2009-2018 Russia (red), OECD - Average (black) |
 Boys
BoysMean score 2018 Russia (red), OECD - Average (black) |
|
| Youth not in employment, education or training (NEET)Indicator |
5.4
15-19 year-old men % in same age group 2019 Russia % in same age group |
 15-19 year-old men
% in same age group 2013-2019 Russia (red), OECD - Average (black) |
 15-19 year-old men
% in same age group 2022 OECD - Average (black) |
|
Find all indicators on Education
| Energy | Latest | Trend | Ranking | |
|---|---|---|---|---|
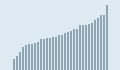
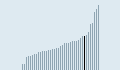
| Crude oil productionIndicator |
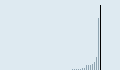
495 676.8
Total Thousand toe 2021 Russia Thousand toe |
 Total
TotalThousand toe 2002-2021 Russia (red) |
 Total
TotalThousand toe 2021 Russia (red) |
|
| Infrastructure investmentIndicator |
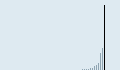
6 953 092 859.20
Road Euro 2020 Russia Euro |
 Road
RoadEuro 2001-2020 Russia (red) |
 Road
RoadEuro 2021 |
|
| Primary energy supplyIndicator |
0.21
Total Toe/1 000 US dollars 2021 Russia Toe/1 000 US dollars |
 Total
TotalToe/1 000 US dollars 2003-2021 Russia (red) |
 Total
TotalToe/1 000 US dollars 2022 Russia (red) |
|
| Road accidentsIndicator |
11
Deaths Per 1 000 000 inhabitants 2020 Russia Per 1 000 000 inhabitants |
 Deaths
Per 1 000 000 inhabitants 2001-2020 Russia (red) |
 Deaths
Per 1 000 000 inhabitants 2022 |
|
| Environment | Latest | Trend | Ranking | |
|---|---|---|---|---|
| Air and GHG emissionsIndicator |
11.7
Carbon dioxide (CO2) Tonnes/capita 2021 Russia Tonnes/capita |
 Carbon dioxide (CO2)
Tonnes/capita 2003-2021 Russia (red), OECD - Total (black) |
 Carbon dioxide (CO2)
Tonnes/capita 2022 Russia (red), OECD - Total (black) |
|
| Municipal wasteIndicator |
562.6
Total Kilograms/capita 2012 Russia Kilograms/capita |
 Total
TotalKilograms/capita 1999-2012 Russia (red), OECD - Total (black) |
 Total
TotalKilograms/capita 2020 OECD - Total (black) |
|
Find all indicators on Environment
| Finance | Latest | Trend | Ranking | |
|---|---|---|---|---|
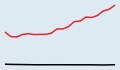
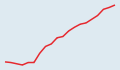
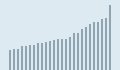
| Broad money (M3)Indicator |
212.16
Total 2015=100 Mar-2023 Russia 2015=100 |
 Total
Total2015=100 Aug-2021-Mar-2023 Russia (red), OECD - Total (black) |
 Total
Total2015=100 Dec-2018 Russia (red), OECD - Total (black) |
|
| Insurance spendingIndicator |
1.4
Total % of GDP 2020 Russia % of GDP |
 Total
Total% of GDP 2006-2020 Russia (red), OECD - Total (black) |
 Total
Total% of GDP 2022 OECD - Total (black) |
|
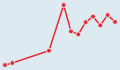
| Long-term interest ratesIndicator |
7.6
Total % per annum Jun-2018 Russia % per annum |
 Total
Total% per annum Nov-2016-Jun-2018 Russia (red) |
 Total
Total% per annum Nov-2023 |
|
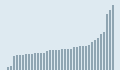
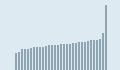
| Pension funds' assetsIndicator |
87 488.6
Total Million US dollars 2020 Russia Million US dollars |
 Total
TotalMillion US dollars 2005-2020 Russia (red) |
 Total
TotalMillion US dollars 2022 |
|
| Short-term interest ratesIndicator |
9.7
Total % per annum Feb-2022 Russia % per annum |
 Total
Total% per annum Jul-2020-Feb-2022 Russia (red), Euro area (19 countries) (black) |
 Total
Total% per annum Nov-2023 Euro area (19 countries) (black) |
|
Find all indicators on Finance
| Government | Latest | Trend | Ranking | |
|---|---|---|---|---|
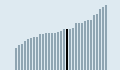
| General government revenueIndicator |
42.5
Total % of GDP 2019 Russia % of GDP |
 Total
Total% of GDP 2011-2019 Russia (red) |
 Total
Total% of GDP 2022 |
|
| General government spendingIndicator | ||||
Find all indicators on Government
| Health | Latest | Trend | Ranking | |
|---|---|---|---|---|
| Hospital bedsIndicator |
8.0
Total Per 1 000 inhabitants 2019 Russia Per 1 000 inhabitants |
 Total
TotalPer 1 000 inhabitants 2000-2019 Russia (red), OECD - Total (black) |
 Total
TotalPer 1 000 inhabitants 2021 |
|
| Length of hospital stayIndicator |
9.10
Acute care Days 2019 Russia Days |
 Acute care
Days 2000-2019 Russia (red) |
 Acute care
Days 2021 |
|
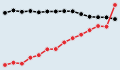
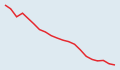
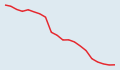
| Life expectancy at birthIndicator |
68.2
Men Years 2019 Russia Years |
 Men
MenYears 2000-2019 Russia (red) |
 Men
MenYears 2022 |
|
| Innovation and Technology | Latest | Trend | Ranking | |
|---|---|---|---|---|
| Gross domestic spending on R&DIndicator |
1.1
Total % of GDP 2020 Russia % of GDP |
 Total
Total% of GDP 2001-2020 Russia (red), OECD - Total (black) |
 Total
Total% of GDP 2021 OECD - Total (black) |
|
| ICT goods exportsIndicator |
1 634.0
Total Million US dollars 2012 Russia Million US dollars |
 Total
TotalMillion US dollars 2000-2012 Russia (red), OECD - Total (black) |
 Total
TotalMillion US dollars 2012 Russia (red), OECD - Total (black) |
|
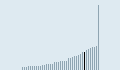
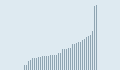
| Triadic patent familiesIndicator |
136.0
Total Number 2020 Russia Number |
 Total
TotalNumber 2001-2020 Russia (red), OECD - Total (black) |
 Total
TotalNumber 2020 Russia (red), OECD - Total (black) |
|
Find all indicators on Innovation and Technology
| Jobs | Latest | Trend | Ranking | |
|---|---|---|---|---|
| Employment rateIndicator |
72.3
Total % of working age population Q4-2021 Russia % of working age population |
 Total
Total% of working age population Q1-2017-Q4-2021 Russia (red), OECD - Total (black) |
 Total
Total% of working age population Q3-2023 |
|
| Hours workedIndicator |
1 874
Total Hours/worker 2020 Russia Hours/worker |
 Total
TotalHours/worker 2001-2020 Russia (red), OECD - Total (black) |
 Total
TotalHours/worker 2022 OECD - Total (black) |
|
| Long-term unemployment rateIndicator |
18.8
Total % of unemployed 2020 Russia % of unemployed |
 Total
Total% of unemployed 2001-2020 Russia (red), OECD - Total (black) |
 Total
Total% of unemployed 2022 OECD - Total (black) |
|
| Part-time employment rateIndicator |
4.1
Total % of employment 2020 Russia % of employment |
 Total
Total% of employment 2001-2020 Russia (red), OECD - Total (black) |
 Total
Total% of employment 2022 OECD - Total (black) |
|
| Self-employment rateIndicator |
6.8
Total % of employment 2020 Russia % of employment |
 Total
Total% of employment 2001-2020 Russia (red), OECD - Total (black) |
 Total
Total% of employment 2022 |
|
| Society | Latest | Trend | Ranking | |
|---|---|---|---|---|
| Elderly populationIndicator |
16.2
Total % of population 2022 Russia % of population |
 Total
Total% of population 2003-2022 Russia (red), OECD - Total (black) |
 Total
Total% of population 2022 Russia (red), OECD - Total (black) |
|
| Fertility ratesIndicator |
1.49
Total Children/woman 2021 Russia Children/woman |
 Total
TotalChildren/woman 2002-2021 Russia (red), OECD - Average (black) |
 Total
TotalChildren/woman 2021 Russia (red), OECD - Average (black) |
|
| Permanent immigrant inflowsIndicator |
412 645.0
Total Number 2011 Russia Number |
 Total
TotalNumber 2007-2011 Russia (red) |
 Total
TotalNumber 2022 |
|
| Poverty rateIndicator |
0.12
Total Ratio 2017 Russia Ratio |
 Total
TotalRatio 2011-2017 Russia (red) |
 Total
TotalRatio 2021 |
|
| Young populationIndicator |
17.7
Total % of population 2022 Russia % of population |
 Total
Total% of population 2003-2022 Russia (red), OECD - Total (black) |
 Total
Total% of population 2022 Russia (red), OECD - Total (black) |
|
