Brazil
- Australia
- Austria
- Belgium
- Brazil
- Canada
- Chile
- China, People's Republic of
- Colombia
- Costa Rica
- Czechia
- Denmark
- Estonia
- Finland
- France
- Germany
- Greece
- Hungary
- Iceland
- India
- Indonesia
- Ireland
- Israel
- Italy
- Japan
- Korea
- Latvia
- Lithuania
- Luxembourg
- Mexico
- Netherlands
- New Zealand
- Norway
- Poland
- Portugal
- Russian Federation
- Slovak Republic
- Slovenia
- South Africa
- Spain
- Sweden
- Switzerland
- Türkiye
- United Kingdom
- United States
Previous editions
Further country information
Selected indicators for Brazil Share
Population
Population, Million persons, 2002-2022
214.8 million
Growth rate: <%population-growth-rate%>%
Income inequality
Income inequality, 0 = complete equality; 1 = complete inequality, latest available year
Education
Mathematics performance (PISA), Mean score, 2018
Reading performance (PISA), Mean score, 2018
Science performance (PISA), Mean score, 2018
CO2 emissions
Air and GHG emissions, Carbon dioxide (CO2), latest available year
2.0 tonnes per capita
GDP
Gross domestic product (GDP), US dollars/capita, 2022
Real GDP forecast, Annual growth rate (%), 2025
<%gdp-latest-value%> US$ per capita
Debt
Household debt, % of net disposable income, 2020
General government debt, % of GDP, 2020
Household debt:
44.8 % of disposable income
Government debt:
117.4 % of GDP
Tax
<%tax-latest-year-dashboard-countries-start-time-info-bubble%>
<%tax-latest-value%> % of GDP
Unemployment
<%unemployment-latest-value-info-bubble%>
<%unemployment-latest-value%> % of labour force
Country profile of Brazil
| Agriculture | Latest | Trend | Ranking | |
|---|---|---|---|---|
| Crop productionIndicator |
2.80
Wheat Tonnes/hectare 2030 Brazil Tonnes/hectare |
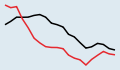
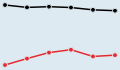
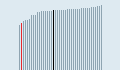
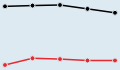
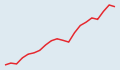
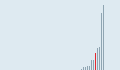
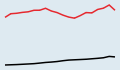
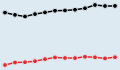
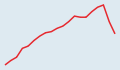
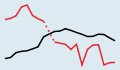
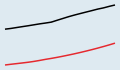
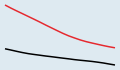
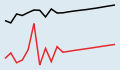 Wheat
WheatTonnes/hectare 2011-2030 Brazil (red), OECD - Total (black) |
||
| Meat consumptionIndicator |
24.4
Beef and veal Kilograms/capita 2029 Brazil Kilograms/capita |
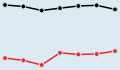
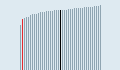
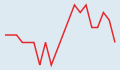
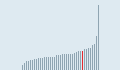
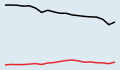
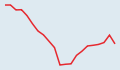
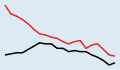
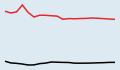 Beef and veal
Kilograms/capita 2010-2029 Brazil (red), OECD - Total (black) |
||
Find all indicators on Agriculture
| Development | Latest | Trend | Ranking | |
|---|---|---|---|---|
| Distribution of net ODAIndicator | ||||
Find all indicators on Development
| Economy | Latest | Trend | Ranking | |
|---|---|---|---|---|
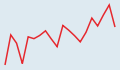
| Composite leading indicator (CLI)Indicator |
100.32
Amplitude adjusted Long-term average = 100 Nov-2023 Brazil Long-term average = 100 |
|||
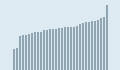
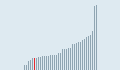
| FDI stocksIndicator |
15.8
Outward % of GDP 2022 Brazil % of GDP |
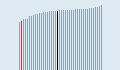
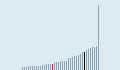
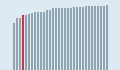
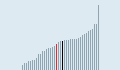
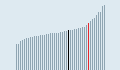
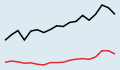 Outward
% of GDP 2005-2022 Brazil (red), OECD - Total (black) |
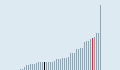
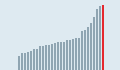
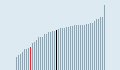
 Outward
% of GDP 2022 Brazil (red), OECD - Total (black) |
|
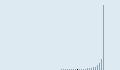
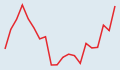
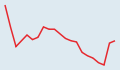
| Inflation (CPI)Indicator |
4.7
Total Annual growth rate (%) Nov-2023 Brazil Annual growth rate (%) |
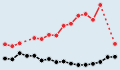
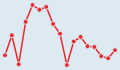
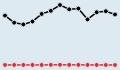
 Total
TotalAnnual growth rate (%) Apr-2022-Nov-2023 Brazil (red), OECD - Total (black) |
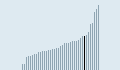
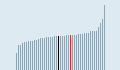
 Total
TotalAnnual growth rate (%) Nov-2023 Brazil (red), OECD - Total (black) |
|
| Trade in goods and servicesIndicator |
16.5
Exports % of GDP 2020 Brazil % of GDP |
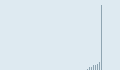
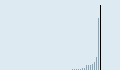
 Exports
% of GDP 2001-2020 Brazil (red) |
 Exports
% of GDP 2022 |
|
Find all indicators on Economy
| Education | Latest | Trend | Ranking | |
|---|---|---|---|---|
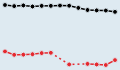
| Mathematics performance (PISA)Indicator |
388
Boys Mean score 2018 Brazil Mean score |
 Boys
BoysMean score 2003-2018 Brazil (red), OECD - Average (black) |
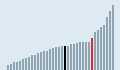
 Boys
BoysMean score 2018 Brazil (red), OECD - Average (black) |
|
| Reading performance (PISA)Indicator |
400
Boys Mean score 2018 Brazil Mean score |
 Boys
BoysMean score 2000-2018 Brazil (red), OECD - Average (black) |
 Boys
BoysMean score 2018 Brazil (red), OECD - Average (black) |
|
| Science performance (PISA)Indicator |
403
Boys Mean score 2018 Brazil Mean score |
 Boys
BoysMean score 2006-2018 Brazil (red), OECD - Average (black) |
 Boys
BoysMean score 2018 Brazil (red), OECD - Average (black) |
|
| Youth not in employment, education or training (NEET)Indicator |
10.5
15-19 year-old men % in same age group 2022 Brazil % in same age group |
 15-19 year-old men
% in same age group 2007-2022 Brazil (red), OECD - Average (black) |
 15-19 year-old men
% in same age group 2022 Brazil (red), OECD - Average (black) |
|
Find all indicators on Education
| Energy | Latest | Trend | Ranking | |
|---|---|---|---|---|
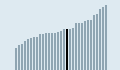
| Crude oil productionIndicator |
150 384.8
Total Thousand toe 2021 Brazil Thousand toe |
 Total
TotalThousand toe 2002-2021 Brazil (red) |
 Total
TotalThousand toe 2021 Brazil (red) |
|
| Primary energy supplyIndicator |
0.09
Total Toe/1 000 US dollars 2022 Brazil Toe/1 000 US dollars |
 Total
TotalToe/1 000 US dollars 2003-2022 Brazil (red) |
 Total
TotalToe/1 000 US dollars 2022 Brazil (red) |
|
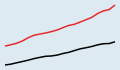
| Renewable energyIndicator |
44.2
Total % of primary energy supply 2021 Brazil % of primary energy supply |
 Total
Total% of primary energy supply 2002-2021 Brazil (red), OECD - Total (black) |
 Total
Total% of primary energy supply 2021 Brazil (red), OECD - Total (black) |
|
| Environment | Latest | Trend | Ranking | |
|---|---|---|---|---|
| Air and GHG emissionsIndicator |
2.0
Carbon dioxide (CO2) Tonnes/capita 2021 Brazil Tonnes/capita |
 Carbon dioxide (CO2)
Tonnes/capita 2003-2021 Brazil (red), OECD - Total (black) |
 Carbon dioxide (CO2)
Tonnes/capita 2022 Brazil (red), OECD - Total (black) |
|
| Municipal wasteIndicator |
292.0
Total Kilograms/capita 2012 Brazil Kilograms/capita |
 Total
TotalKilograms/capita 2000-2012 Brazil (red), OECD - Total (black) |
 Total
TotalKilograms/capita 2020 OECD - Total (black) |
|
Find all indicators on Environment
| Finance | Latest | Trend | Ranking | |
|---|---|---|---|---|
| Broad money (M3)Indicator |
136.18
Total 2015=100 Dec-2018 Brazil 2015=100 |
 Total
Total2015=100 May-2017-Dec-2018 Brazil (red), OECD - Total (black) |
 Total
Total2015=100 Dec-2018 Brazil (red), OECD - Total (black) |
|
| Insurance spendingIndicator |
3.3
Total % of GDP 2022 Brazil % of GDP |
 Total
Total% of GDP 2011-2022 Brazil (red), OECD - Total (black) |
 Total
Total% of GDP 2022 Brazil (red), OECD - Total (black) |
|
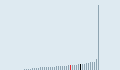
| Pension funds' assetsIndicator |
210 668.8
Total Million US dollars 2022 Brazil Million US dollars |
 Total
TotalMillion US dollars 2006-2022 Brazil (red) |
 Total
TotalMillion US dollars 2022 Brazil (red) |
|
Find all indicators on Finance
| Government | Latest | Trend | Ranking | |
|---|---|---|---|---|
| General government revenueIndicator |
58.3
Total % of GDP 2020 Brazil % of GDP |
 Total
Total% of GDP 2001-2020 Brazil (red) |
 Total
Total% of GDP 2022 |
|
| General government spendingIndicator | ||||
Find all indicators on Government
| Health | Latest | Trend | Ranking | |
|---|---|---|---|---|
| Hospital bedsIndicator |
2.5
Total Per 1 000 inhabitants 2021 Brazil Per 1 000 inhabitants |
 Total
TotalPer 1 000 inhabitants 2001-2021 Brazil (red), OECD - Total (black) |
 Total
TotalPer 1 000 inhabitants 2021 Brazil (red) |
|
| Length of hospital stayIndicator | ||||
| Life expectancy at birthIndicator |
69.6
Men Years 2022 Brazil Years |
 Men
MenYears 2003-2022 Brazil (red) |
 Men
MenYears 2022 Brazil (red) |
|
| Innovation and Technology | Latest | Trend | Ranking | |
|---|---|---|---|---|
| ICT goods exportsIndicator |
1 325.0
Total Million US dollars 2012 Brazil Million US dollars |
 Total
TotalMillion US dollars 2000-2012 Brazil (red), OECD - Total (black) |
 Total
TotalMillion US dollars 2012 Brazil (red), OECD - Total (black) |
|
Find all indicators on Innovation and Technology
| Jobs | Latest | Trend | Ranking | |
|---|---|---|---|---|
| Employment rateIndicator | ||||
| Part-time employment rateIndicator |
14.2
Total % of employment 2022 Brazil % of employment |
 Total
Total% of employment 2002-2022 Brazil (red), OECD - Total (black) |
 Total
Total% of employment 2022 Brazil (red), OECD - Total (black) |
|
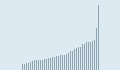
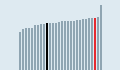
| Self-employment rateIndicator |
32.1
Total % of employment 2022 Brazil % of employment |
 Total
Total% of employment 2002-2022 Brazil (red), OECD - Total (black) |
 Total
Total% of employment 2022 Brazil (red) |
|
| Society | Latest | Trend | Ranking | |
|---|---|---|---|---|
| Elderly populationIndicator |
10.5
Total % of population 2022 Brazil % of population |
 Total
Total% of population 2003-2022 Brazil (red), OECD - Total (black) |
 Total
Total% of population 2022 Brazil (red), OECD - Total (black) |
|
| Fertility ratesIndicator |
1.64
Total Children/woman 2021 Brazil Children/woman |
 Total
TotalChildren/woman 2002-2021 Brazil (red), OECD - Average (black) |
 Total
TotalChildren/woman 2021 Brazil (red), OECD - Average (black) |
|
| Young populationIndicator |
20.5
Total % of population 2022 Brazil % of population |
 Total
Total% of population 2003-2022 Brazil (red), OECD - Total (black) |
 Total
Total% of population 2022 Brazil (red), OECD - Total (black) |
|
