India
- Australia
- Austria
- Belgium
- Brazil
- Canada
- Chile
- China, People's Republic of
- Colombia
- Costa Rica
- Czechia
- Denmark
- Estonia
- Finland
- France
- Germany
- Greece
- Hungary
- Iceland
- India
- Indonesia
- Ireland
- Israel
- Italy
- Japan
- Korea
- Latvia
- Lithuania
- Luxembourg
- Mexico
- Netherlands
- New Zealand
- Norway
- Poland
- Portugal
- Russian Federation
- Slovak Republic
- Slovenia
- South Africa
- Spain
- Sweden
- Switzerland
- Türkiye
- United Kingdom
- United States
Previous editions
Further country information
Selected indicators for India Share
Population
Population, Million persons, 2002-2022
1 417.2 million
Growth rate: <%population-growth-rate%>%
Income inequality
Income inequality, 0 = complete equality; 1 = complete inequality, latest available year
Education
<%pisamath-info-bubble%>
<%pisaread-info-bubble%>
<%pisascience-info-bubble%>
CO2 emissions
Air and GHG emissions, Carbon dioxide (CO2), latest available year
1.6 tonnes per capita
GDP
Gross domestic product (GDP), US dollars/capita, 2022
Real GDP forecast, Annual growth rate (%), 2025
<%gdp-latest-value%> US$ per capita
Debt
Household debt:
<%debthousehold-latest-value%> % of disposable income
Government debt:
<%debtgovernment-latest-value%> % of GDP
Tax
<%tax-latest-year-dashboard-countries-start-time-info-bubble%>
<%tax-latest-value%> % of GDP
Unemployment
<%unemployment-latest-value-info-bubble%>
<%unemployment-latest-value%> % of labour force
Country profile of India
| Agriculture | Latest | Trend | Ranking | |
|---|---|---|---|---|
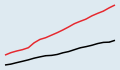
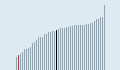
| Crop productionIndicator |
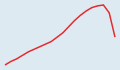
3.71
Wheat Tonnes/hectare 2030 India Tonnes/hectare |
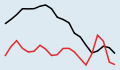
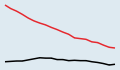
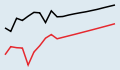 Wheat
WheatTonnes/hectare 2011-2030 India (red), OECD - Total (black) |
||
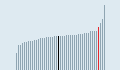
| Meat consumptionIndicator |
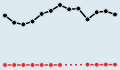
0.6
Beef and veal Kilograms/capita 2029 India Kilograms/capita |
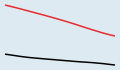
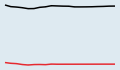 Beef and veal
Kilograms/capita 2010-2029 India (red), OECD - Total (black) |
||
Find all indicators on Agriculture
| Development | Latest | Trend | Ranking | |
|---|---|---|---|---|
| Distribution of net ODAIndicator | ||||
Find all indicators on Development
| Economy | Latest | Trend | Ranking | |
|---|---|---|---|---|
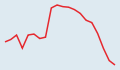
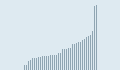
| Composite leading indicator (CLI)Indicator |
99.50
Amplitude adjusted Long-term average = 100 Nov-2023 India Long-term average = 100 |
|||
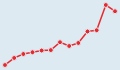
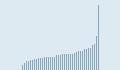
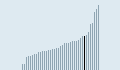
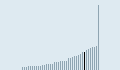
| FDI stocksIndicator |
6.4
Outward % of GDP 2022 India % of GDP |
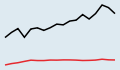 Outward
% of GDP 2005-2022 India (red), OECD - Total (black) |
 Outward
% of GDP 2022 India (red), OECD - Total (black) |
|
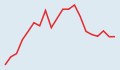
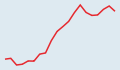
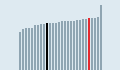
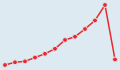
| Inflation (CPI)Indicator |
4.5
Total Annual growth rate (%) Oct-2023 India Annual growth rate (%) |
 Total
TotalAnnual growth rate (%) Mar-2022-Oct-2023 India (red), OECD - Total (black) |
 Total
TotalAnnual growth rate (%) Nov-2023 OECD - Total (black) |
|
| Net national incomeIndicator | ||||
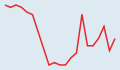
| Trade in goods and servicesIndicator |
18.7
Exports % of GDP 2020 India % of GDP |
 Exports
% of GDP 2001-2020 India (red) |
 Exports
% of GDP 2022 |
|
Find all indicators on Economy
| Education | Latest | Trend | Ranking | |
|---|---|---|---|---|
| Youth not in employment, education or training (NEET)Indicator | ||||
Find all indicators on Education
| Energy | Latest | Trend | Ranking | |
|---|---|---|---|---|
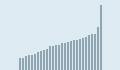
| Crude oil productionIndicator |
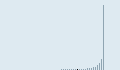
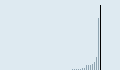
30 546.6
Total Thousand toe 2021 India Thousand toe |
 Total
TotalThousand toe 2002-2021 India (red) |
 Total
TotalThousand toe 2021 India (red) |
|
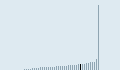
| Infrastructure investmentIndicator |
12 461 385 188.78
Road Euro 2016 India Euro |
 Road
RoadEuro 2004-2016 India (red) |
 Road
RoadEuro 2021 |
|
| Primary energy supplyIndicator |
0.10
Total Toe/1 000 US dollars 2021 India Toe/1 000 US dollars |
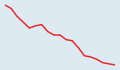 Total
TotalToe/1 000 US dollars 2003-2021 India (red) |
 Total
TotalToe/1 000 US dollars 2022 India (red) |
|
| Road accidentsIndicator |
11
Deaths Per 1 000 000 inhabitants 2017 India Per 1 000 000 inhabitants |
 Deaths
Per 1 000 000 inhabitants 1998-2017 India (red) |
 Deaths
Per 1 000 000 inhabitants 2022 |
|
| Environment | Latest | Trend | Ranking | |
|---|---|---|---|---|
| Air and GHG emissionsIndicator |
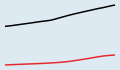
1.6
Carbon dioxide (CO2) Tonnes/capita 2021 India Tonnes/capita |
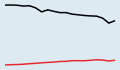 Carbon dioxide (CO2)
Tonnes/capita 2003-2021 India (red), OECD - Total (black) |
 Carbon dioxide (CO2)
Tonnes/capita 2022 India (red), OECD - Total (black) |
|
| Municipal wasteIndicator | ||||
Find all indicators on Environment
| Finance | Latest | Trend | Ranking | |
|---|---|---|---|---|
| Broad money (M3)Indicator |
134.80
Total 2015=100 Dec-2018 India 2015=100 |
 Total
Total2015=100 May-2017-Dec-2018 India (red), OECD - Total (black) |
 Total
Total2015=100 Dec-2018 India (red), OECD - Total (black) |
|
| Insurance spendingIndicator |
4.2
Total % of GDP 2020 India % of GDP |
 Total
Total% of GDP 2011-2020 India (red), OECD - Total (black) |
 Total
Total% of GDP 2022 OECD - Total (black) |
|
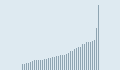
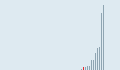
| Pension funds' assetsIndicator |
103 092.7
Total Million US dollars 2022 India Million US dollars |
 Total
TotalMillion US dollars 2011-2022 India (red) |
 Total
TotalMillion US dollars 2022 India (red) |
|
Find all indicators on Finance
| Government | Latest | Trend | Ranking | |
|---|---|---|---|---|
| General government revenueIndicator | ||||
| General government spendingIndicator | ||||
Find all indicators on Government
| Health | Latest | Trend | Ranking | |
|---|---|---|---|---|
| Hospital bedsIndicator |
0.5
Total Per 1 000 inhabitants 2017 India Per 1 000 inhabitants |
 Total
TotalPer 1 000 inhabitants 1997-2017 India (red), OECD - Total (black) |
 Total
TotalPer 1 000 inhabitants 2021 |
|
| Length of hospital stayIndicator | ||||
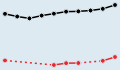
| Life expectancy at birthIndicator |
65.8
Men Years 2022 India Years |
 Men
MenYears 2003-2022 India (red) |
 Men
MenYears 2022 India (red) |
|
| Innovation and Technology | Latest | Trend | Ranking | |
|---|---|---|---|---|
| ICT goods exportsIndicator |
5 719.0
Total Million US dollars 2012 India Million US dollars |
 Total
TotalMillion US dollars 2000-2012 India (red), OECD - Total (black) |
 Total
TotalMillion US dollars 2012 India (red), OECD - Total (black) |
|
Find all indicators on Innovation and Technology
| Jobs | Latest | Trend | Ranking | |
|---|---|---|---|---|
| Employment rateIndicator | ||||
| Long-term unemployment rateIndicator | ||||
| Society | Latest | Trend | Ranking | |
|---|---|---|---|---|
| Elderly populationIndicator |
6.9
Total % of population 2022 India % of population |
 Total
Total% of population 2003-2022 India (red), OECD - Total (black) |
 Total
Total% of population 2022 India (red), OECD - Total (black) |
|
| Fertility ratesIndicator |
2.03
Total Children/woman 2021 India Children/woman |
 Total
TotalChildren/woman 2002-2021 India (red), OECD - Average (black) |
 Total
TotalChildren/woman 2021 India (red), OECD - Average (black) |
|
| Young populationIndicator |
25.3
Total % of population 2022 India % of population |
 Total
Total% of population 2003-2022 India (red), OECD - Total (black) |
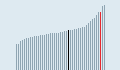 Total
Total% of population 2022 India (red), OECD - Total (black) |
|
