Latvia
- Australia
- Austria
- Belgium
- Brazil
- Canada
- Chile
- China, People's Republic of
- Colombia
- Costa Rica
- Czechia
- Denmark
- Estonia
- Finland
- France
- Germany
- Greece
- Hungary
- Iceland
- India
- Indonesia
- Ireland
- Israel
- Italy
- Japan
- Korea
- Latvia
- Lithuania
- Luxembourg
- Mexico
- Netherlands
- New Zealand
- Norway
- Poland
- Portugal
- Russian Federation
- Slovak Republic
- Slovenia
- South Africa
- Spain
- Sweden
- Switzerland
- Türkiye
- United Kingdom
- United States
Previous editions
Further country information
Selected indicators for Latvia Share
Population
Population, Million persons, 2002-2022
1.9 million
Growth rate: <%population-growth-rate%>%
Income inequality
Income inequality, 0 = complete equality; 1 = complete inequality, latest available year
Education
Mathematics performance (PISA), Mean score, 2018
Reading performance (PISA), Mean score, 2018
Science performance (PISA), Mean score, 2018
CO2 emissions
Air and GHG emissions, Carbon dioxide (CO2), latest available year
3.1 tonnes per capita
GDP
Gross domestic product (GDP), US dollars/capita, 2022
Real GDP forecast, Annual growth rate (%), 2025
41 474 US$ per capita
Debt
Household debt, % of net disposable income, 2022
General government debt, % of GDP, 2022
Household debt:
36.9 % of disposable income
Government debt:
49.7 % of GDP
Tax
Tax on personal income, % of GDP, 2022
5.8 % of GDP
Unemployment
<%unemployment-latest-value-info-bubble%>
<%unemployment-latest-value%> % of labour force
Country profile of Latvia
| Agriculture | Latest | Trend | Ranking | |
|---|---|---|---|---|
| Crop productionIndicator | ||||
Find all indicators on Agriculture
| Development | Latest | Trend | Ranking | |
|---|---|---|---|---|
| Distribution of net ODAIndicator |
1.1
Least developed countries Million US dollars 2022 Latvia Million US dollars |
 Least developed countries
Million US dollars 2007-2022 Latvia (red), DAC Countries (black) |
 Least developed countries
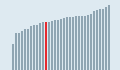
Million US dollars 2022 Latvia (red), DAC Countries (black) |
|
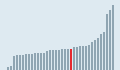
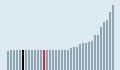
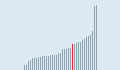
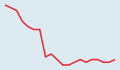
| Net ODAIndicator |
0.2
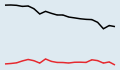
ODA grant equivalent % of gross national income 2022 Latvia % of gross national income |
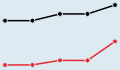 ODA grant equivalent
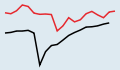
% of gross national income 2018-2022 Latvia (red), DAC Countries (black) |
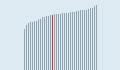
 ODA grant equivalent
% of gross national income 2022 Latvia (red), DAC Countries (black) |
|
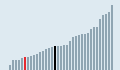
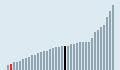
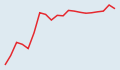
| Total official and private flowsIndicator |
83.2
Total Million US dollars 2022 Latvia Million US dollars |
 Total
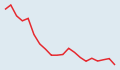
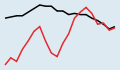
TotalMillion US dollars 2013-2022 Latvia (red), DAC Countries (black) |
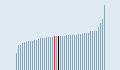
 Total
TotalMillion US dollars 2022 Latvia (red), DAC Countries (black) |
|
Find all indicators on Development
| Economy | Latest | Trend | Ranking | |
|---|---|---|---|---|
| Composite leading indicator (CLI)Indicator | ||||
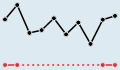
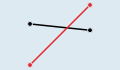
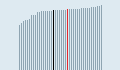
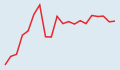
| Labour compensation per hour workedIndicator |
6.8
Total Annual growth rate (%) 2021 Latvia Annual growth rate (%) |
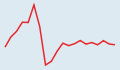 Total
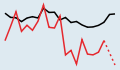
TotalAnnual growth rate (%) 2002-2021 Latvia (red) |
 Total
TotalAnnual growth rate (%) 2022 |
|
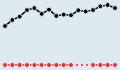
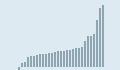
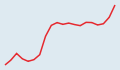
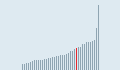
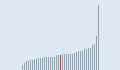
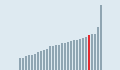
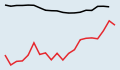
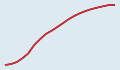
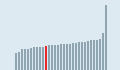
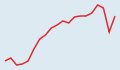
| Net national incomeIndicator |
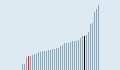
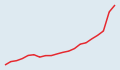
31 840
Total US dollars/capita 2022 Latvia US dollars/capita |
 Total
TotalUS dollars/capita 2003-2022 Latvia (red), OECD - Total (black) |
 Total
TotalUS dollars/capita 2022 Latvia (red) |
|
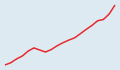
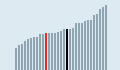
| Trade in goods and servicesIndicator |
72.0
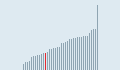
Exports % of GDP 2022 Latvia % of GDP |
 Exports
% of GDP 2003-2022 Latvia (red) |
 Exports
% of GDP 2022 Latvia (red) |
|
Find all indicators on Economy
| Education | Latest | Trend | Ranking | |
|---|---|---|---|---|
| Mathematics performance (PISA)Indicator |
500
Boys Mean score 2018 Latvia Mean score |
 Boys
BoysMean score 2015-2018 Latvia (red), OECD - Average (black) |
 Boys
BoysMean score 2018 Latvia (red), OECD - Average (black) |
|
| Reading performance (PISA)Indicator |
462
Boys Mean score 2018 Latvia Mean score |
 Boys
BoysMean score 2015-2018 Latvia (red), OECD - Average (black) |
 Boys
BoysMean score 2018 Latvia (red), OECD - Average (black) |
|
| Science performance (PISA)Indicator |
483
Boys Mean score 2018 Latvia Mean score |
 Boys
BoysMean score 2015-2018 Latvia (red), OECD - Average (black) |
 Boys
BoysMean score 2018 Latvia (red), OECD - Average (black) |
|
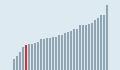
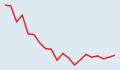
| Youth not in employment, education or training (NEET)Indicator |
2.3
15-19 year-old men % in same age group 2022 Latvia % in same age group |
 15-19 year-old men
% in same age group 2002-2022 Latvia (red), OECD - Average (black) |
 15-19 year-old men
% in same age group 2022 Latvia (red), OECD - Average (black) |
|
Find all indicators on Education
| Energy | Latest | Trend | Ranking | |
|---|---|---|---|---|
| Crude oil productionIndicator |
0.0
Total Thousand toe 2021 Latvia Thousand toe |
 Total
TotalThousand toe 2002-2021 Latvia (red) |
 Total
TotalThousand toe 2021 Latvia (red) |
|
| Infrastructure investmentIndicator |
201 000 000.00
Road Euro 2021 Latvia Euro |
 Road
RoadEuro 2002-2021 Latvia (red) |
 Road
RoadEuro 2021 Latvia (red) |
|
| Primary energy supplyIndicator |
0.07
Total Toe/1 000 US dollars 2022 Latvia Toe/1 000 US dollars |
 Total
TotalToe/1 000 US dollars 2003-2022 Latvia (red) |
 Total
TotalToe/1 000 US dollars 2022 Latvia (red) |
|
| Road accidentsIndicator |
6
Deaths Per 1 000 000 inhabitants 2022 Latvia Per 1 000 000 inhabitants |
 Deaths
Per 1 000 000 inhabitants 2003-2022 Latvia (red) |
 Deaths
Per 1 000 000 inhabitants 2022 Latvia (red) |
|
| Environment | Latest | Trend | Ranking | |
|---|---|---|---|---|
| Air and GHG emissionsIndicator |
3.1
Carbon dioxide (CO2) Tonnes/capita 2022 Latvia Tonnes/capita |
 Carbon dioxide (CO2)
Tonnes/capita 2003-2022 Latvia (red), OECD - Total (black) |
 Carbon dioxide (CO2)
Tonnes/capita 2022 Latvia (red), OECD - Total (black) |
|
| Municipal wasteIndicator |
461.1
Total Kilograms/capita 2021 Latvia Kilograms/capita |
 Total
TotalKilograms/capita 2002-2021 Latvia (red), OECD - Total (black) |
 Total
TotalKilograms/capita 2020 Latvia (red), OECD - Total (black) |
|
| Water withdrawalsIndicator |
184.5
Total Million m3 2021 Latvia Million m3 |
 Total
TotalMillion m3 2002-2021 Latvia (red) |
 Total
TotalMillion m3 2020 Latvia (red) |
|
Find all indicators on Environment
| Finance | Latest | Trend | Ranking | |
|---|---|---|---|---|
| Broad money (M3)Indicator | ||||
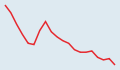
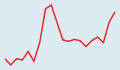
| Long-term interest ratesIndicator |
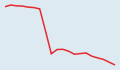
4.0
Total % per annum Nov-2023 Latvia % per annum |
 Total
Total% per annum Apr-2022-Nov-2023 Latvia (red) |
 Total
Total% per annum Nov-2023 Latvia (red) |
|
| Short-term interest ratesIndicator |
4.0
Total % per annum Nov-2023 Latvia % per annum |
 Total
Total% per annum Apr-2022-Nov-2023 Latvia (red), Euro area (19 countries) (black) |
 Total
Total% per annum Nov-2023 Latvia (red), Euro area (19 countries) (black) |
|
Find all indicators on Finance
| Government | Latest | Trend | Ranking | |
|---|---|---|---|---|
| General government spendingIndicator |
44.4
Total % of GDP 2021 Latvia % of GDP |
 Total
Total% of GDP 2002-2021 Latvia (red) |
 Total
Total% of GDP 2021 Latvia (red) |
|
Find all indicators on Government
| Health | Latest | Trend | Ranking | |
|---|---|---|---|---|
| Health spendingIndicator |
3 445
Total US dollars/capita 2022 Latvia US dollars/capita |
 Total
TotalUS dollars/capita 2003-2022 Latvia (red) |
 Total
TotalUS dollars/capita 2022 Latvia (red) |
|
| Hospital bedsIndicator |
5.2
Total Per 1 000 inhabitants 2021 Latvia Per 1 000 inhabitants |
 Total
TotalPer 1 000 inhabitants 2002-2021 Latvia (red), OECD - Total (black) |
 Total
TotalPer 1 000 inhabitants 2021 Latvia (red) |
|
| Length of hospital stayIndicator |
6.00
Acute care Days 2021 Latvia Days |
 Acute care
Days 2002-2021 Latvia (red) |
 Acute care
Days 2021 Latvia (red) |
|
| Life expectancy at birthIndicator |
69.8
Men Years 2022 Latvia Years |
 Men
MenYears 2003-2022 Latvia (red) |
 Men
MenYears 2022 Latvia (red) |
|
| Innovation and Technology | Latest | Trend | Ranking | |
|---|---|---|---|---|
Find all indicators on Innovation and Technology
| Jobs | Latest | Trend | Ranking | |
|---|---|---|---|---|
| Employment rateIndicator |
71.9
Total % of working age population Q3-2023 Latvia % of working age population |
 Total
Total% of working age population Q4-2018-Q3-2023 Latvia (red), OECD - Total (black) |
 Total
Total% of working age population Q3-2023 Latvia (red) |
|
| Society | Latest | Trend | Ranking | |
|---|---|---|---|---|
| Fertility ratesIndicator |
1.57
Total Children/woman 2021 Latvia Children/woman |
 Total
TotalChildren/woman 2002-2021 Latvia (red), OECD - Average (black) |
 Total
TotalChildren/woman 2021 Latvia (red), OECD - Average (black) |
|
