Czechia
- Australia
- Austria
- Belgium
- Brazil
- Canada
- Chile
- China, People's Republic of
- Colombia
- Costa Rica
- Czechia
- Denmark
- Estonia
- Finland
- France
- Germany
- Greece
- Hungary
- Iceland
- India
- Indonesia
- Ireland
- Israel
- Italy
- Japan
- Korea
- Latvia
- Lithuania
- Luxembourg
- Mexico
- Netherlands
- New Zealand
- Norway
- Poland
- Portugal
- Russian Federation
- Slovak Republic
- Slovenia
- South Africa
- Spain
- Sweden
- Switzerland
- Türkiye
- United Kingdom
- United States
Previous editions
Further country information
Selected indicators for Czechia Share
Population
Population, Million persons, 2002-2022
10.8 million
Growth rate: <%population-growth-rate%>%
Income inequality
Income inequality, 0 = complete equality; 1 = complete inequality, latest available year
Education
Mathematics performance (PISA), Mean score, 2018
Reading performance (PISA), Mean score, 2018
Science performance (PISA), Mean score, 2018
CO2 emissions
Air and GHG emissions, Carbon dioxide (CO2), latest available year
8.6 tonnes per capita
GDP
Gross domestic product (GDP), US dollars/capita, 2022
Real GDP forecast, Annual growth rate (%), 2025
51 619 US$ per capita
Debt
Household debt, % of net disposable income, 2022
General government debt, % of GDP, 2022
Household debt:
73.5 % of disposable income
Government debt:
48.1 % of GDP
Tax
Tax on personal income, % of GDP, 2022
3.1 % of GDP
Unemployment
<%unemployment-latest-value-info-bubble%>
<%unemployment-latest-value%> % of labour force
Country profile of Czechia
| Agriculture | Latest | Trend | Ranking | |
|---|---|---|---|---|
| Agricultural landIndicator |
1 005.53
Permanent pasture Thousand hectares 2021 Czechia Thousand hectares |
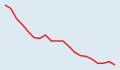
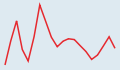
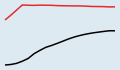
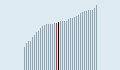
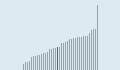
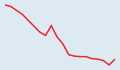
 Permanent pasture
Thousand hectares 2002-2021 Czechia (red) |
 Permanent pasture
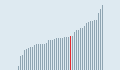
Thousand hectares 2021 Czechia (red) |
|
| Agricultural supportIndicator | ||||
| Crop productionIndicator | ||||
| Nutrient balanceIndicator |
75.6
Nitrogen Kilograms/hectare 2019 Czechia Kilograms/hectare |
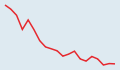
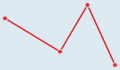
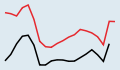
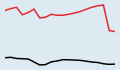
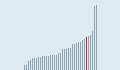
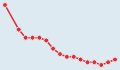
 Nitrogen
Kilograms/hectare 2000-2019 Czechia (red) |
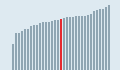
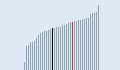
 Nitrogen
Kilograms/hectare 2019 Czechia (red) |
|
Find all indicators on Agriculture
| Development | Latest | Trend | Ranking | |
|---|---|---|---|---|
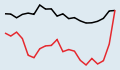
| Distribution of net ODAIndicator |
20.5
Least developed countries Million US dollars 2022 Czechia Million US dollars |
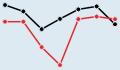
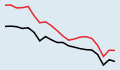
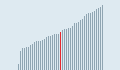
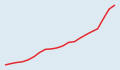
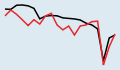
 Least developed countries
Million US dollars 2003-2022 Czechia (red), DAC Countries (black) |
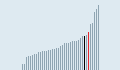
 Least developed countries
Million US dollars 2022 Czechia (red), DAC Countries (black) |
|
| Grants by private agencies and NGOsIndicator |
1.4
Total Million US dollars 2009 Czechia Million US dollars |
 Total
TotalMillion US dollars 2009 Czechia (red), DAC Countries (black) |
||
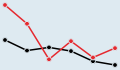
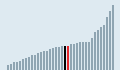
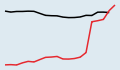
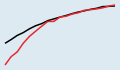
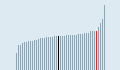
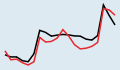
| Net ODAIndicator |
0.4
ODA grant equivalent % of gross national income 2022 Czechia % of gross national income |
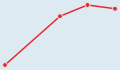
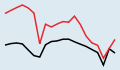
 ODA grant equivalent
% of gross national income 2018-2022 Czechia (red), DAC Countries (black) |
 ODA grant equivalent
% of gross national income 2022 Czechia (red), DAC Countries (black) |
|
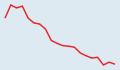
| Private flowsIndicator |
-120.9
Total Million US dollars 2022 Czechia Million US dollars |
 Total
TotalMillion US dollars 2014-2022 Czechia (red), DAC Countries (black) |
 Total
TotalMillion US dollars 2020 Czechia (red), DAC Countries (black) |
|
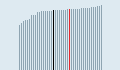
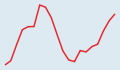
| Total official and private flowsIndicator |
919.3
Total Million US dollars 2022 Czechia Million US dollars |
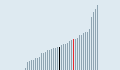
 Total
TotalMillion US dollars 2003-2022 Czechia (red), DAC Countries (black) |
 Total
TotalMillion US dollars 2022 Czechia (red), DAC Countries (black) |
|
Find all indicators on Development
| Economy | Latest | Trend | Ranking | |
|---|---|---|---|---|
| Composite leading indicator (CLI)Indicator | ||||
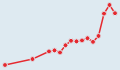
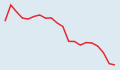
| Household disposable incomeIndicator |
-1.92
Gross Per capita, percentage change, previous period Q1-2023 Czechia Per capita, percentage change, previous period |
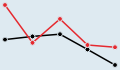
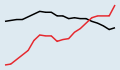
 Gross
GrossPer capita, percentage change, previous period Q2-2018-Q1-2023 Czechia (red), OECD - Total (black) |
 Gross
GrossPer capita, percentage change, previous period Q1-2022 Czechia (red), OECD - Total (black) |
|
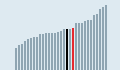
| Labour compensation per hour workedIndicator |
3.3
Total Annual growth rate (%) 2022 Czechia Annual growth rate (%) |
 Total
TotalAnnual growth rate (%) 2003-2022 Czechia (red) |
 Total
TotalAnnual growth rate (%) 2022 Czechia (red) |
|
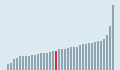
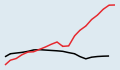
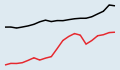
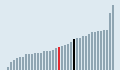
| Net national incomeIndicator |
38 292
Total US dollars/capita 2022 Czechia US dollars/capita |
 Total
TotalUS dollars/capita 2003-2022 Czechia (red), OECD - Total (black) |
 Total
TotalUS dollars/capita 2022 Czechia (red) |
|
| Trade in goods and servicesIndicator |
76.5
Exports % of GDP 2022 Czechia % of GDP |
 Exports
% of GDP 2003-2022 Czechia (red) |
 Exports
% of GDP 2022 Czechia (red) |
|
Find all indicators on Economy
| Education | Latest | Trend | Ranking | |
|---|---|---|---|---|
| Education spendingIndicator |
16 237
Tertiary US dollars/student 2020 Czechia US dollars/student |
 Tertiary
US dollars/student 2000-2020 Czechia (red) |
 Tertiary
US dollars/student 2020 Czechia (red) |
|
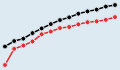
| Mathematics performance (PISA)Indicator |
501
Boys Mean score 2018 Czechia Mean score |
 Boys
BoysMean score 2003-2018 Czechia (red), OECD - Average (black) |
 Boys
BoysMean score 2018 Czechia (red), OECD - Average (black) |
|
| Reading performance (PISA)Indicator |
474
Boys Mean score 2018 Czechia Mean score |
 Boys
BoysMean score 2000-2018 Czechia (red), OECD - Average (black) |
 Boys
BoysMean score 2018 Czechia (red), OECD - Average (black) |
|
| Science performance (PISA)Indicator |
496
Boys Mean score 2018 Czechia Mean score |
 Boys
BoysMean score 2006-2018 Czechia (red), OECD - Average (black) |
 Boys
BoysMean score 2018 Czechia (red), OECD - Average (black) |
|
| Youth not in employment, education or training (NEET)Indicator |
8.2
15-19 year-old men % in same age group 2022 Czechia % in same age group |
 15-19 year-old men
% in same age group 2003-2022 Czechia (red), OECD - Average (black) |
 15-19 year-old men
% in same age group 2022 Czechia (red), OECD - Average (black) |
|
Find all indicators on Education
| Energy | Latest | Trend | Ranking | |
|---|---|---|---|---|
| Crude oil productionIndicator |
85.3
Total Thousand toe 2021 Czechia Thousand toe |
 Total
TotalThousand toe 2002-2021 Czechia (red) |
 Total
TotalThousand toe 2021 Czechia (red) |
|
| Infrastructure investmentIndicator |
1 817 146 778.55
Road Euro 2021 Czechia Euro |
 Road
RoadEuro 2002-2021 Czechia (red) |
 Road
RoadEuro 2021 Czechia (red) |
|
| Passenger transportIndicator |
100 471.6
Road Million passenger-kilometres 2022 Czechia Million passenger-kilometres |
Million passenger-kilometres 2003-2022 Czechia (red) |
Million passenger-kilometres 2013 Czechia (red) |
|
| Primary energy supplyIndicator |
0.10
Total Toe/1 000 US dollars 2022 Czechia Toe/1 000 US dollars |
 Total
TotalToe/1 000 US dollars 2003-2022 Czechia (red) |
 Total
TotalToe/1 000 US dollars 2022 Czechia (red) |
|
| Road accidentsIndicator |
5
Deaths Per 1 000 000 inhabitants 2022 Czechia Per 1 000 000 inhabitants |
 Deaths
Per 1 000 000 inhabitants 2003-2022 Czechia (red) |
 Deaths
Per 1 000 000 inhabitants 2022 Czechia (red) |
|
| Environment | Latest | Trend | Ranking | |
|---|---|---|---|---|
| Air and GHG emissionsIndicator |
8.6
Carbon dioxide (CO2) Tonnes/capita 2022 Czechia Tonnes/capita |
 Carbon dioxide (CO2)
Tonnes/capita 2003-2022 Czechia (red), OECD - Total (black) |
 Carbon dioxide (CO2)
Tonnes/capita 2022 Czechia (red), OECD - Total (black) |
|
| Municipal wasteIndicator |
570.5
Total Kilograms/capita 2021 Czechia Kilograms/capita |
 Total
TotalKilograms/capita 2002-2021 Czechia (red), OECD - Total (black) |
 Total
TotalKilograms/capita 2020 Czechia (red), OECD - Total (black) |
|
| Water withdrawalsIndicator |
1 348.5
Total Million m3 2021 Czechia Million m3 |
 Total
TotalMillion m3 2002-2021 Czechia (red) |
 Total
TotalMillion m3 2020 Czechia (red) |
|
Find all indicators on Environment
| Finance | Latest | Trend | Ranking | |
|---|---|---|---|---|
| Broad money (M3)Indicator |
186.23
Total 2015=100 Sep-2023 Czechia 2015=100 |
 Total
Total2015=100 Feb-2022-Sep-2023 Czechia (red), OECD - Total (black) |
 Total
Total2015=100 Dec-2018 Czechia (red), OECD - Total (black) |
|
| Long-term interest ratesIndicator |
4.4
Total % per annum Nov-2023 Czechia % per annum |
 Total
Total% per annum Apr-2022-Nov-2023 Czechia (red) |
 Total
Total% per annum Nov-2023 Czechia (red) |
|
| Net pension replacement ratesIndicator |
58.9
Men % of pre-retirement earnings 2022 Czechia % of pre-retirement earnings |
 Men
Men% of pre-retirement earnings 2014-2022 Czechia (red), OECD - Total (black) |
 Men
Men% of pre-retirement earnings 2022 Czechia (red) |
|
| Net pension wealthIndicator |
12.0
Men Multiple of annual gross earnings 2022 Czechia Multiple of annual gross earnings |
 Men
MenMultiple of annual gross earnings 2014-2022 Czechia (red), OECD - Total (black) |
 Men
MenMultiple of annual gross earnings 2022 Czechia (red) |
|
| Short-term interest ratesIndicator |
7.1
Total % per annum Nov-2023 Czechia % per annum |
 Total
Total% per annum Apr-2022-Nov-2023 Czechia (red), Euro area (19 countries) (black) |
 Total
Total% per annum Nov-2023 Czechia (red), Euro area (19 countries) (black) |
|
Find all indicators on Finance
| Government | Latest | Trend | Ranking | |
|---|---|---|---|---|
| General government spendingIndicator |
46.5
Total % of GDP 2021 Czechia % of GDP |
 Total
Total% of GDP 2002-2021 Czechia (red) |
 Total
Total% of GDP 2021 Czechia (red) |
|
| Government reservesIndicator |
37 342.3
Total SDR millions Q4-2014 Czechia SDR millions |
 Total
TotalSDR millions Q1-2010-Q4-2014 Czechia (red) |
 Total
TotalSDR millions Q4-2014 Czechia (red) |
|
| Tax on corporate profitsIndicator |
4.0
Total % of GDP 2022 Czechia % of GDP |
 Total
Total% of GDP 2003-2022 Czechia (red), OECD - Average (black) |
 Total
Total% of GDP 2022 Czechia (red) |
|
| Tax revenueIndicator |
33.9
Total % of GDP 2022 Czechia % of GDP |
 Total
Total% of GDP 2003-2022 Czechia (red), OECD - Average (black) |
 Total
Total% of GDP 2022 Czechia (red), OECD - Average (black) |
|
| Tax wedgeIndicator |
39.8
Total % of labour cost 2022 Czechia % of labour cost |
 Total
Total% of labour cost 2003-2022 Czechia (red), OECD - Average (black) |
 Total
Total% of labour cost 2022 Czechia (red), OECD - Average (black) |
|
Find all indicators on Government
| Health | Latest | Trend | Ranking | |
|---|---|---|---|---|
| Health spendingIndicator |
4 512
Total US dollars/capita 2022 Czechia US dollars/capita |
 Total
TotalUS dollars/capita 2003-2022 Czechia (red) |
 Total
TotalUS dollars/capita 2022 Czechia (red) |
|
| Hospital bedsIndicator |
6.7
Total Per 1 000 inhabitants 2021 Czechia Per 1 000 inhabitants |
 Total
TotalPer 1 000 inhabitants 2002-2021 Czechia (red), OECD - Total (black) |
 Total
TotalPer 1 000 inhabitants 2021 Czechia (red) |
|
| Length of hospital stayIndicator |
5.90
Acute care Days 2021 Czechia Days |
 Acute care
Days 2001-2021 Czechia (red) |
 Acute care
Days 2021 Czechia (red) |
|
| Life expectancy at birthIndicator |
76.2
Men Years 2022 Czechia Years |
 Men
MenYears 2003-2022 Czechia (red) |
 Men
MenYears 2022 Czechia (red) |
|
| Overweight or obese populationIndicator |
55.0
Measured % of population aged 15+ 2010 Czechia % of population aged 15+ |
 Measured
% of population aged 15+ 2000-2010 Czechia (red) |
||
| Innovation and Technology | Latest | Trend | Ranking | |
|---|---|---|---|---|
| Gross domestic spending on R&DIndicator |
2.0
Total % of GDP 2021 Czechia % of GDP |
 Total
Total% of GDP 2002-2021 Czechia (red), OECD - Total (black) |
 Total
Total% of GDP 2021 Czechia (red), OECD - Total (black) |
|
| ICT value addedIndicator |
5.7
Total % of value added 2011 Czechia % of value added |
 Total
Total% of value added 2011 Czechia (red), OECD - Total (black) |
||
| Internet accessIndicator |
92.8
Total % of all households 2023 Czechia % of all households |
 Total
Total% of all households 2005-2023 Czechia (red), OECD - Total (black) |
 Total
Total% of all households 2023 Czechia (red), OECD - Total (black) |
|
| Mobile broadband subscriptionsIndicator |
103.1
Total Per 100 inhabitants 2022 Czechia Per 100 inhabitants |
 Total
TotalPer 100 inhabitants 2010-2022 Czechia (red), OECD - Total (black) |
 Total
TotalPer 100 inhabitants 2022 Czechia (red), OECD - Total (black) |
|
| Triadic patent familiesIndicator |
45.2
Total Number 2020 Czechia Number |
 Total
TotalNumber 2001-2020 Czechia (red), OECD - Total (black) |
 Total
TotalNumber 2020 Czechia (red), OECD - Total (black) |
|
Find all indicators on Innovation and Technology
| Jobs | Latest | Trend | Ranking | |
|---|---|---|---|---|
| Average wagesIndicator |
33 475.5
Total US dollars 2022 Czechia US dollars |
 Total
TotalUS dollars 2003-2022 Czechia (red), OECD - Total (black) |
 Total
TotalUS dollars 2022 Czechia (red), OECD - Total (black) |
|
| Employment rateIndicator |
75.1
Total % of working age population Q3-2023 Czechia % of working age population |
 Total
Total% of working age population Q4-2018-Q3-2023 Czechia (red), OECD - Total (black) |
 Total
Total% of working age population Q3-2023 Czechia (red) |
|
| Hours workedIndicator |
1 754
Total Hours/worker 2022 Czechia Hours/worker |
 Total
TotalHours/worker 2003-2022 Czechia (red), OECD - Total (black) |
 Total
TotalHours/worker 2022 Czechia (red), OECD - Total (black) |
|
| Long-term unemployment rateIndicator |
33.9
Total % of unemployed 2022 Czechia % of unemployed |
 Total
Total% of unemployed 2003-2022 Czechia (red), OECD - Total (black) |
 Total
Total% of unemployed 2022 Czechia (red), OECD - Total (black) |
|
| Self-employment rateIndicator |
16.0
Total % of employment 2022 Czechia % of employment |
 Total
Total% of employment 2003-2022 Czechia (red), OECD - Total (black) |
 Total
Total% of employment 2022 Czechia (red) |
|
| Society | Latest | Trend | Ranking | |
|---|---|---|---|---|
| Fertility ratesIndicator |
1.83
Total Children/woman 2021 Czechia Children/woman |
 Total
TotalChildren/woman 2002-2021 Czechia (red), OECD - Average (black) |
 Total
TotalChildren/woman 2021 Czechia (red), OECD - Average (black) |
|
| National population distributionIndicator |
11.9
Urban regions Percentage 2014 Czechia Percentage |
 Urban regions
Percentage 2014 Czechia (red) |
||
| Permanent immigrant inflowsIndicator |
45 630.0
Total Number 2022 Czechia Number |
 Total
TotalNumber 2003-2022 Czechia (red) |
 Total
TotalNumber 2022 Czechia (red) |
|
| Poverty rateIndicator |
0.06
Total Ratio 2021 Czechia Ratio |
 Total
TotalRatio 2004-2021 Czechia (red) |
 Total
TotalRatio 2021 Czechia (red) |
|
| Social spendingIndicator |
22.0
Public % of GDP 2022 Czechia % of GDP |
 Public
% of GDP 2003-2022 Czechia (red), OECD - Total (black) |
 Public
% of GDP 2022 Czechia (red), OECD - Total (black) |
|
