Corporate sector
| Corporate sectorIndicator Group | ||
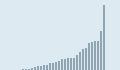
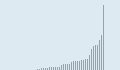
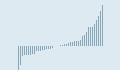
| Value-added in financial corporationsIndicator in group Corporate sector |
 Compensation of employees
% of net value added 2022 |
|
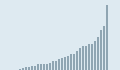
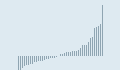
| Value-added in non-financial corporationsIndicator in group Corporate sector |
 Compensation of employees
% of net value added 2022 |
|
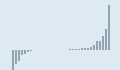
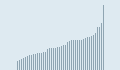
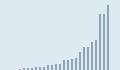
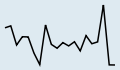
| Financial corporations debt to equity ratioIndicator in group Corporate sector |
 Total
TotalRatio 2022 |
|
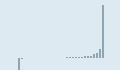
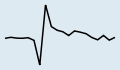
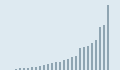
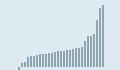
| Non-Financial corporations debt to surplus ratioIndicator in group Corporate sector |
 Total
TotalRatio 2022 |
|
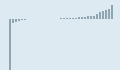
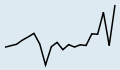
| Banking sector leverageIndicator in group Corporate sector |
 Total
Total% of net value added 2022 |
|
| National Accounts at a GlanceDatabase OECD National Accounts Statistics | ||
| Data warehouseDatabase OECD.Stat | ||
| National Accounts of OECD Countries, Financial Balance SheetsPublication (2023) | ||
| National Accounts of OECD CountriesPublication (2023) | ||
| Understanding National AccountsPublication (2014) | ||
Foreign direct investment (FDI)


Database Find more databases on Foreign direct investment (FDI)
GDP and spending
| GDP and spendingIndicator Group | ||
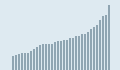
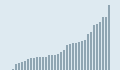
| Gross domestic product (GDP)Indicator in group GDP and spending |
55 681
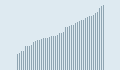
Total US dollars/capita 2022 OECD - Total US dollars/capita |
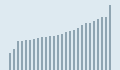
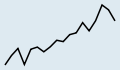
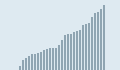
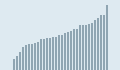
 Total
TotalUS dollars/capita 2003-2022 OECD - Total |
| Domestic demand forecastIndicator in group GDP and spending |
 Total
TotalAnnual growth rate (%) Q4-2025 World |
|
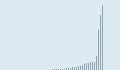
| Quarterly GDPIndicator in group GDP and spending |
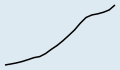
0.41
Total Percentage change, previous period Q3-2023 OECD - Total Percentage change, previous period |
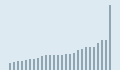
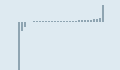
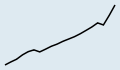
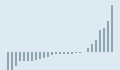
 Total
TotalPercentage change, previous period Q4-2018-Q3-2023 OECD - Total |
| Real GDP forecastIndicator in group GDP and spending |
 Total
TotalAnnual growth rate (%) Q4-2025 |
|
| Nominal GDP forecastIndicator in group GDP and spending |
 Total
TotalAnnual growth rate (%) Q4-2025 OECD - Total |
|
| Real GDP long-term forecastIndicator in group GDP and spending |
 Total
TotalMillion US dollars 2060 |
|
| Investment (GFCF)Indicator in group GDP and spending |
0.69
Total Quarterly growth rate (%) Q3-2023 OECD - Total Quarterly growth rate (%) |
 Total
TotalQuarterly growth rate (%) Q4-2018-Q3-2023 OECD - Total |
| Investment forecastIndicator in group GDP and spending |
 Total
TotalAnnual growth rate (%) Q4-2025 World |
|
| Investment by sectorIndicator in group GDP and spending |
 Household
% of GFCF 2022 |
|
| Investment by assetIndicator in group GDP and spending |
 Dwellings
% of GFCF 2022 |
|
| Aggregate National Accounts, SNA 2008 (or SNA 1993): Gross domestic productDatabase OECD National Accounts Statistics | ||
| Data warehouseDatabase OECD.Stat | ||
| OECD Economic OutlookPublication (2024) | ||
| National Accounts of OECD CountriesPublication (2023) | ||
| Understanding National AccountsPublication (2014) | ||
Household accounts
International trade


Leading indicators
| Leading indicatorsIndicator Group | ||
| Composite leading indicator (CLI)Indicator in group Leading indicators | ||
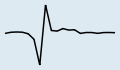
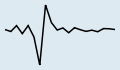
| Business confidence index (BCI)Indicator in group Leading indicators |
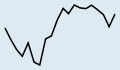
99.12
Amplitude adjusted Long-term average = 100 Nov-2023 OECD - Total Long-term average = 100 |
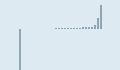
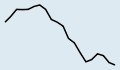
 Amplitude adjusted
Long-term average = 100 Apr-2022-Nov-2023 OECD - Total |
| Consumer confidence index (CCI)Indicator in group Leading indicators |
98.03
Amplitude adjusted Long-term average = 100 Nov-2023 OECD - Total Long-term average = 100 |
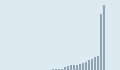
 Amplitude adjusted
Long-term average = 100 Apr-2022-Nov-2023 OECD - Total |
| Composite leading indicatorsDatabase Main Economic Indicators | ||
| Data warehouseDatabase OECD.Stat | ||
| Main Economic IndicatorsPublication (2023) | ||
| OECD Journal: Journal of Business Cycle Measurement and AnalysisPublication (2016) | ||
| OECD FactbookPublication (2016) | ||
National income
| National incomeIndicator Group | ||
| Value added by activityIndicator in group National income |
 Agriculture, forestry, fishing
% of value added 2022 |
|
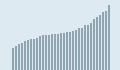
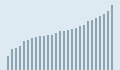
| Gross national incomeIndicator in group National income |
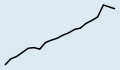
43 830
Total US dollars/capita 2017 OECD - Total US dollars/capita |
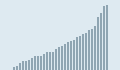
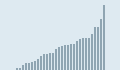
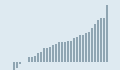
 Total
TotalUS dollars/capita 2009-2017 OECD - Total |
| Net national incomeIndicator in group National income |
 Total
TotalUS dollars/capita 2022 OECD - Total |
|
| Net lending/borrowing by sectorIndicator in group National income |
 Total
Total% of GDP 2022 |
|
| Saving rateIndicator in group National income |
 Total
Total% of GDP 2022 |
|
| National Accounts at a GlanceDatabase OECD National Accounts Statistics | ||
| Data warehouseDatabase OECD.Stat | ||
| National Accounts of OECD CountriesPublication (2023) | ||
| Understanding National AccountsPublication (2014) | ||
Prices
| PricesIndicator Group | ||
| Inflation (CPI)Indicator in group Prices |
5.4
Total Annual growth rate (%) Nov-2023 OECD - Total Annual growth rate (%) |
 Total
TotalAnnual growth rate (%) Apr-2022-Nov-2023 OECD - Total |
| Inflation forecastIndicator in group Prices |
 Total
TotalAnnual growth rate (%) Q4-2025 OECD - Total |
|
| Producer price indices (PPI)Indicator in group Prices |
 Manufacturing, domestic market
2015=100 Dec-2022 European Union (28 countries) |
|
| Price level indicesIndicator in group Prices |
 Total
TotalOECD=100 2022 European Union (28 countries) |
|
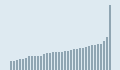
| Housing pricesIndicator in group Prices |
177.38
Nominal house prices 2015=100 Q3-2023 OECD - Total 2015=100 |
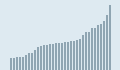
 Nominal house prices
2015=100 Q4-2018-Q3-2023 OECD - Total |
| Share pricesIndicator in group Prices |
125.76
Total 2015=100 Nov-2023 Euro area (19 countries) 2015=100 |
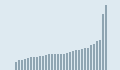
 Total
Total2015=100 Apr-2022-Nov-2023 Euro area (19 countries) |
| Prices: Consumer pricesDatabase Main Economic Indicators | ||
| Data warehouseDatabase OECD.Stat | ||
| OECD Economic OutlookPublication (2024) | ||
| Main Economic IndicatorsPublication (2023) | ||
Database Find more databases on Prices
Productivity
Database Find more databases on Productivity
Loading more results